UX/UI & Interaction Design | Chicago, IL | chloe.allegra.quinn@gmail.com
Minneapolis, MN Tourism Map
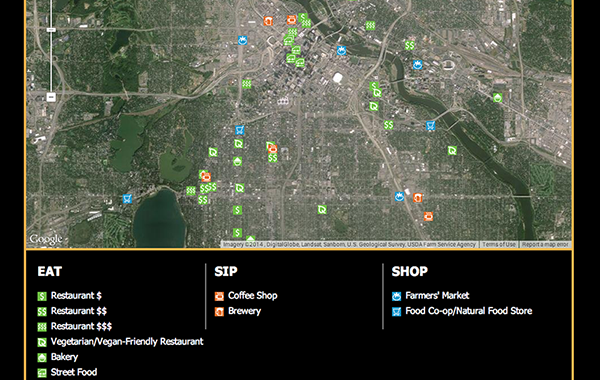
A slippy map of Minneapolis tourism, highlighting the City's food and drink scene. The icons represent different edible & drinkable options to be explored in the city, including bakeries and breweries. Click on the image to view the map.
Tools utilized to make this map: Adobe Photoshop & Illustrator HTML, CSS, JavaScript Google Maps API
U.S. Coal Mining Emissions Map
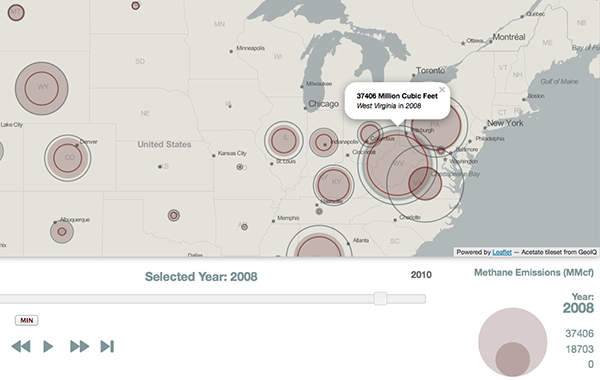
This interactive project built upon a Leaflet basemap illustrates the methane emmissions associated with coal mining by state. Click on the image to view the project.
Tools utilized to make this map: Leaflet.js HTML, CSS, JavaScript, jQuery UI
Renewable Energy Sources Map
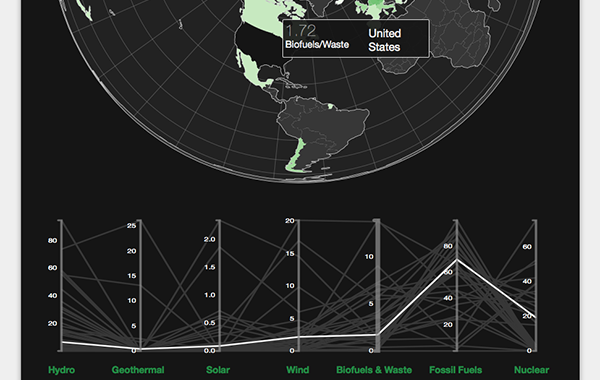
An interactive map leveraging D3.js to show energy produced from renewable sources in comparison to that generated from fossil fuels and nuclear power. Feel free to click on the image to view the project.
Tools utilized to make this map: D3.js HTML, CSS, JavaScript, jQuery UI